This area (Odontogram) displays a graphical representation of the teeth in the patient’s upper and lower jaws, including Base Charting, Historical Charting and Planned Treatment. The Tooth Chart can be displayed in two dimensional or via 3d charting. This guide looks at 2-dimensional tooth charting.
...
The tooth chart has 32 teeth (8 per quarter) and 20 Deciduous teeth. Each is split sectors of the tooth.
Planned treatment is shown blue by default in blue, but this colour can be customised in the Treatment Planning settingsby double-clicking a Course of Treatment bar:
...
Completed treatment will be displayed in the colour defined in the Treatment Planning settings.is defined by each service.
...
Permanent / Deciduous Switch
The 2D Tooth Chart can be viewed in three modes. Click on the ‘Permanent/Deciduous switch’ at the left centre of the Tooth Chart to change the view to each of three different displays:
Permanent Dentition is the default mode:
...
Mixed Dentition displayed as follows:
...
Deciduous Dentition displayed as follows:
...
EXACT ‘remembers’ in which state the dentition either Permanent, Mixed or Deciduous. The default selection for new patients can be changed in Configure, Practice Settings. EXACT ‘remembers’ the dentition that was last displayed, and will appear this way when you next open the patient’s record.
Permanent, Mixed & Deciduous Dentitions are displayed as follows:
...
Base / Current Chart Switch
This switch to the right centre of the Tooth Chart filters the information shown on the Tooth Chart. If a patient has a base chart with lots of charting, you may find it easier to chart required treatment onto a clear chart.
...
...
With the switch in this position (B) only the Base Chart will be displayed.
...
...
This position (centre) will display all charting, base and planned.
...
...
This position (C) will display Current treatment only; all base charting will be hidden.
to one of 3 options.
Base charting only, All charting or current charting (shown on open courses of treatment).
...
To change the position of the switch, click on it with the mouse; it will then cycle between the various positions. For example, in the top illustration above, the switch is in the 'B' or “Base Chart” setting. When clicked it will move to the middle “All” position, then to the bottom “Current Treatment” setting, then back to “Base”.
Hovering Over Teeth
The Quick Chart Menu hovers over the chart as you move the mouse cursor over teeth: appears when you hover the cursor over the chart.
...
The Treatment menu displays for the current tooth, listing both Historical and Current Treatments:
...
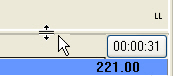
Hover the mouse pointer in the grey area either below or to the side of the chart (UL).
A symbol will appear, as shown in the example below. Click on this symbol, and keeping the left mouse button pressed down, drag until you achieve the desired result.
The Tooth Chart will continue to be displayed this way until changed again. However, the selection is individual to the computer, so the chart can be displayed differently in each treatment room if required.
To return the Tooth Chart to its default setting, hover the mouse arrow again until the symbol appears, and drag using an upward motion.
...