Most users use the 2D Ondontagram, however, there is an option to see a 3d reproesentation representation of the tooth chart.
The 3D model can be displayed without any treatment. The 3D chart includes the following features:
...
The first time that the 3D Chart is activated, a wizard will appear to take you through the configuration. The wizard needs to be run only once on each workstation but it can be run from the Configure menu at any time to change settings if there are hardware changes. Note that the wizard may be available only to a user with administrative security rights. To enable the 3D Tooth Chart:
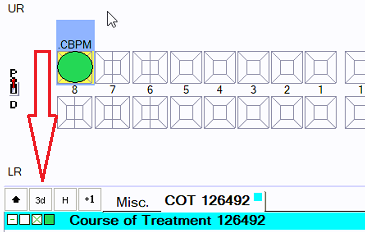
Click the 3D button

The 3D Chart Setup window will appear:

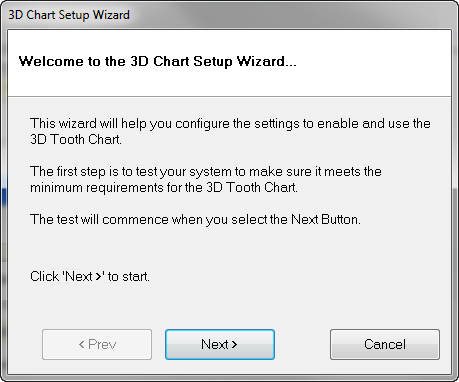
Click Next> to continue. EXACT will check your hardware and software to determine the available rendering modes and automatically default to the best option.
When the hardware / software check is completed, click Next> to continue.
To enable the 3D chart, check (tick) the Enable 3D Charting checkbox and click the Finish button to complete the Wizard.
Once the 3D Chart set-up wizard has been completed you are now able to use 3D Charting.
...
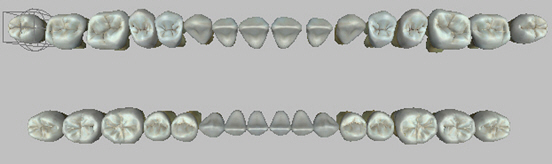
'Chart' mode, as displayed in this example:

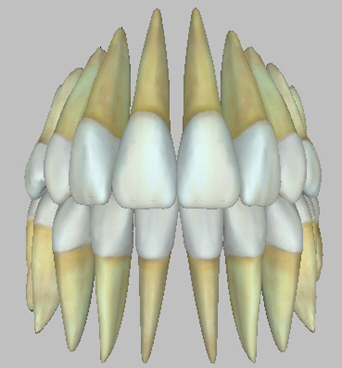
'Jaw' mode, as shown below:

The chart shows all teeth that are charted as being present, along with completed treatment. Any planned treatment on the chart is shown in blue, as in this example:
...
Jaw Movement in 3D Jaw Mode
...
To activate the ‘Jaw’ mode, click on the “Jaw” button under the ‘View’ section.
...
Tooth Movement in 3D Jaw Mode
...
To Move a Tooth:
Click on the ‘Move Tooth’ button.
Click on the required tooth and hold the left or right mouse button down, according to what movement you require (see above).
Move the mouse in the required direction and the tooth will move accordingly. You will notice that a yellow box appears around the currently selected tooth. If you are not in ‘Tooth’ mode, this box will appear in grey.
Release the mouse button when you have reached the required position.
...
Open the 3D tooth Chart
Select ‘Jaw’ mode
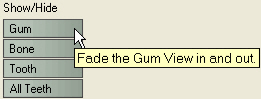
Under the "Show/Hide" menu, click on the ‘Show Gum’, or ‘Show Bone’ buttons as required.
Click and drag the slider to set the opacity.
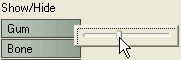
Click and drag the slider to set the opacity level that best displays the image you require.
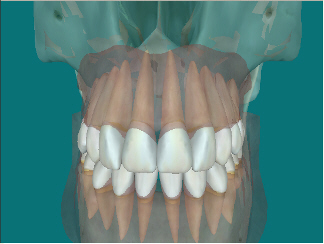
The example below shows the 3d chart with bone, gum and all teeth options activated:

Use the following controls to show the root canals of all or selected teeth:
...
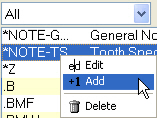
From the patient’s ‘Chart’ tab, right click anywhere in the Service List area and select ‘Add’ from the Menu.
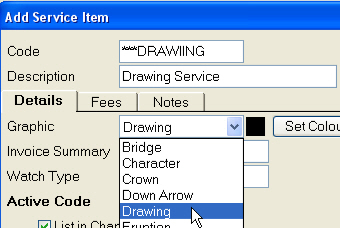
Enter a Code and Description for the new Service, then click In the Graphic Field and select ‘Drawing’, or Filling if it is a filling related service:


Set any other characteristics for the service and click the ‘OK’ button to save the new drawing service.
...
From the patient’s ‘Chart’ tab, right click anywhere in the Service List area and select ‘Add’ from the Menu.

Enter a Code and Description for the new Service, then click In the Graphic Field and select ‘Drawing’, or Filling if it is a filling related service:

Set any other characteristics for the service and click the ‘OK’ button to save the new drawing service.
 See also "The Service Items Details Tab" for how tooth treatments may be represented graphically.
...
From the patient’s Chart tab, select the required service from the Service List and drag it into the Treatment Plan area.
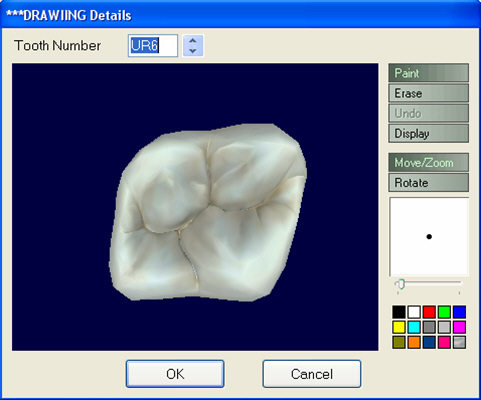
The following window will appear automatically if your service was set to Drawing:

If your service graphic was set to Filling, first chart the filling normally, then double-click on the chart line in the planning window. From here you can open the Edit Drawing window where the standard filling shape will already be drawn, and you simply tweak the drawing as required.
When using the Drawing graphic, the tooth selected will be the one highlighted on the Tooth chart. If necessary use the up/down arrow buttons to scroll through the Tooth Chart and select a different tooth, or click a different tooth on the chart.
Hold the left mouse button down and use the mouse pointer to draw on the tooth. While doing so the following functions will be useful:
...
When completed the window will look similar to the following example:
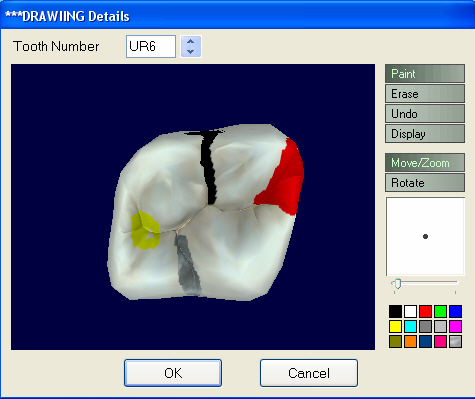

Click OK to save the drawing.
It will be added to the Current Course of Treatment:
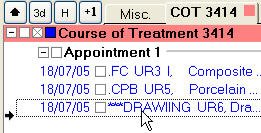
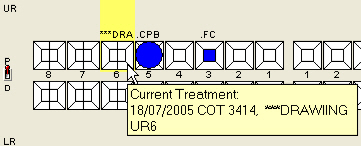
The Tooth Chart will also indicate that a drawing of the tooth exists:

To edit the drawing at any time, double-click on the item in the Treatment Plan to open the ‘Edit Chart Item’ window.
Clicking on the “Edit Drawing” button within this window will reopen the drawing to view it or make changes.
...