To use Quick Charting effectively it's important to configure it to each provider's individual needs.
The Quick Chart Menu template has a top Base menu and bottom Treatment menu. Right-click anywhere on the quick chart interface and click Configure:

The Configure Quick Chart Menu window opens by default at the Base tab
Simply drag-and-drop Base or Treatment Services and Quick Plans from one of the 3 tabs on the right hand side onto the cells of the Quick Chart Menu or double click for auto-population.

Resize the Quick Chart Menu as required by dragging from the right corner:

Click “Select Graphic” after highlighting a service or quick plan to change its graphic.
Copying Quick Chart Menus Between Providers
In the Configure Quick Chart Menu window, fully configure a Quick Chart Menu for Provider A.
Click the Copy To button at the bottom left, and select Providers B, C, D... to whom to copy it to.
If at any point you are configuring a Provider Quick Chart Menu, click the Copy From button, and select an pre-configured Provider from whom, to copy from.

To check the percentage service usage
Once a Provider completes and charges (or TCs) some treatment plans, EXACT is able to calculate which services this Provider has used most frequently.
In the Configure Quick Chart Menu, user would now choose the "Recalculate List" for EXACT to check which services are used most often. For practical application, the dentist would periodically go into Configure Quick Chart Menu (as needed) and choose "Recalculate List".
To Autofill the Quick Chart Menu
Autofill enables you to automatically populate the menus with the most commonly used services in the business, that are not already on the menu.
To calculate current usage percentages and re-sort the services list by most frequent usage
You have the option to click the Calculate Current Usage Percentages button prior to an Autofill, which will cause EXACT to recalculate all of the lists for all users simultaneously, and may take some time.

Customisation limitations:
For purposes of populating the hover menu, EXACT identifies your most frequently used services and positions them at the top of service lists.
If you drag a service onto an occupied square it will replace the existing service icon.
You can place services that do not have icons, but they will show up with the 'not set' icon.
To remove a service drag the icon anywhere off the menu grid or Right Click and Clear
Some graphics are pre-set:
All the services with a chart graphic type have a fixed menu graphic that cannot be edited except with the colour setting.
Fillings have a standard MO shape, with the graphic scaled to fit the line height. The icon cannot be customised, and the Select Graphic button is greyed out.
The purpose of Quick Charting is there to help reduce the number of clicks and chart your most common treatments from one location, speeding up the charting process.
Enabling Quick Charting (reveal/hide Quick Charting)
Configure Quick Charting
Copying Quick Charting between Providers
Recalculate Usage Percentages
Auto Fill Quick Charting
Using/Charting with Quick Charting
Edit Quick Charting
Service Graphics
Quick Charting hiding the Tooth Chart
Enabling Quick Charting (reveal/hide Quick Charting)
To enable Quick Charting, hover over a tooth and Right Click the yellow box displaying the tooth charting then click Show Quick Chart Menu.
To hide Quick Charting, hover over a tooth and Right Click the Quick Charting service or yellow box displaying the tooth charting then click Hide Quick Chart Menu.
Configure Quick Charting
To use Quick Charting effectively it's important to configure it to each provider's individual needs.
The Quick Chart Menu template has a top Base menu and bottom Treatment menu. Right-click anywhere on the quick chart interface and click Configure:
The Configure Quick Chart Menu window opens by default at the Base tab
Drag-and-drop Base or Treatment Services and Quick Plans from one of the 3 tabs on the right hand side onto the cells of the Quick Chart Menu or double click for auto-population.
Note: Dragging and dropping a service icon into an occupied square will replace the existing service.
Resize the Quick Chart Menu as required by dragging from the right corner:
Click “Select Graphic” after highlighting a service or quick plan to change its graphic.
It is possible to add multiple tabs to separate types of services, this can be completed for both the upper and lower Quick Chart menus. To add additional tabs,
Click + to add a new tab
Double click the title of any tab to rename, press enter to save
Copying Quick Charting Between Providers
It is possible to copy the Quick Chart configuration of any Provider within the same practice.
Note: There is no way to reverse the process of copying Quick Charting from another Provider. |
Open the Configure Quick Chart Menu.
Select Copy From and choose the Provider initials Quick Chart configuration you wish to copy and press OK.
Administrators have the ability to Copy To, allowing them to give a provider another providers Quick Charting setup.
Recalculate Usage Percentages
Once a Provider completes and charges (or TCs) some treatment plans, EXACT is able to calculate which services this Provider has most frequently used.
To use this feature, open the Configure Quick Chart Menu and press the Recalculate Usage Percentages button to calculate the most commonly used treatments. This will order the list from most used to least with a Usage percentage next to each treatment.
Tip: Periodically recalculate your usage percentages to ensure your Quick Charting displays your most used treatments. |
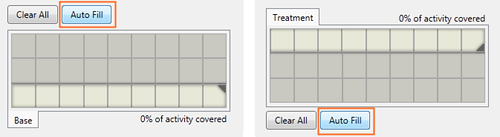
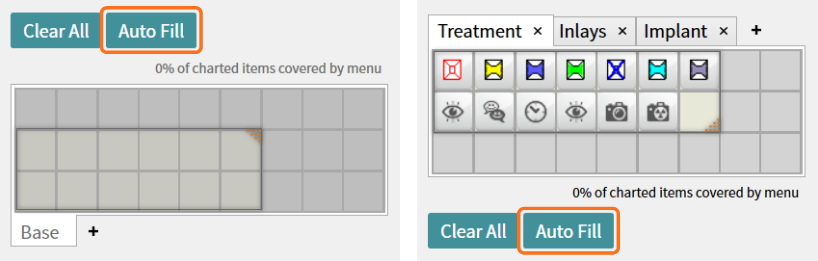
Auto Fill Quick Charting
Auto Fill enables you to automatically populate Quick Charting menus with the most commonly used treatments in the business, that are not already displayed.
The option to Auto Fill is available for both Base and Treatment Charting with their own buttons to populate the menu.
Note: Recalculating Usege Percentages will perform this for all providers simultaneously and therefore may take some time to complete. |
Using/Charting with Quick Charting
Using/Charting is covered in full in the help article Using Quick Charting.
Edit Quick Charting
There are two options to remove services from a Quick Charting menu:
Right click a service icon and select clear
Click and hold on a service icon and drag off the grid (a red bin icon appears on the icon)
Service Graphics
Services with no icons can be placed onto the grid with the 'not set' icon.
Any service with a chart graphic type have a fixed menu graphic that cannot be edited with the exception of the colour setting.
Fillings have a standard MO shape with the graphic scaled to fir the line height. The select graphic button is greyed out and the icon cannot be customised.
Quick Charting covering the Tooth Chart
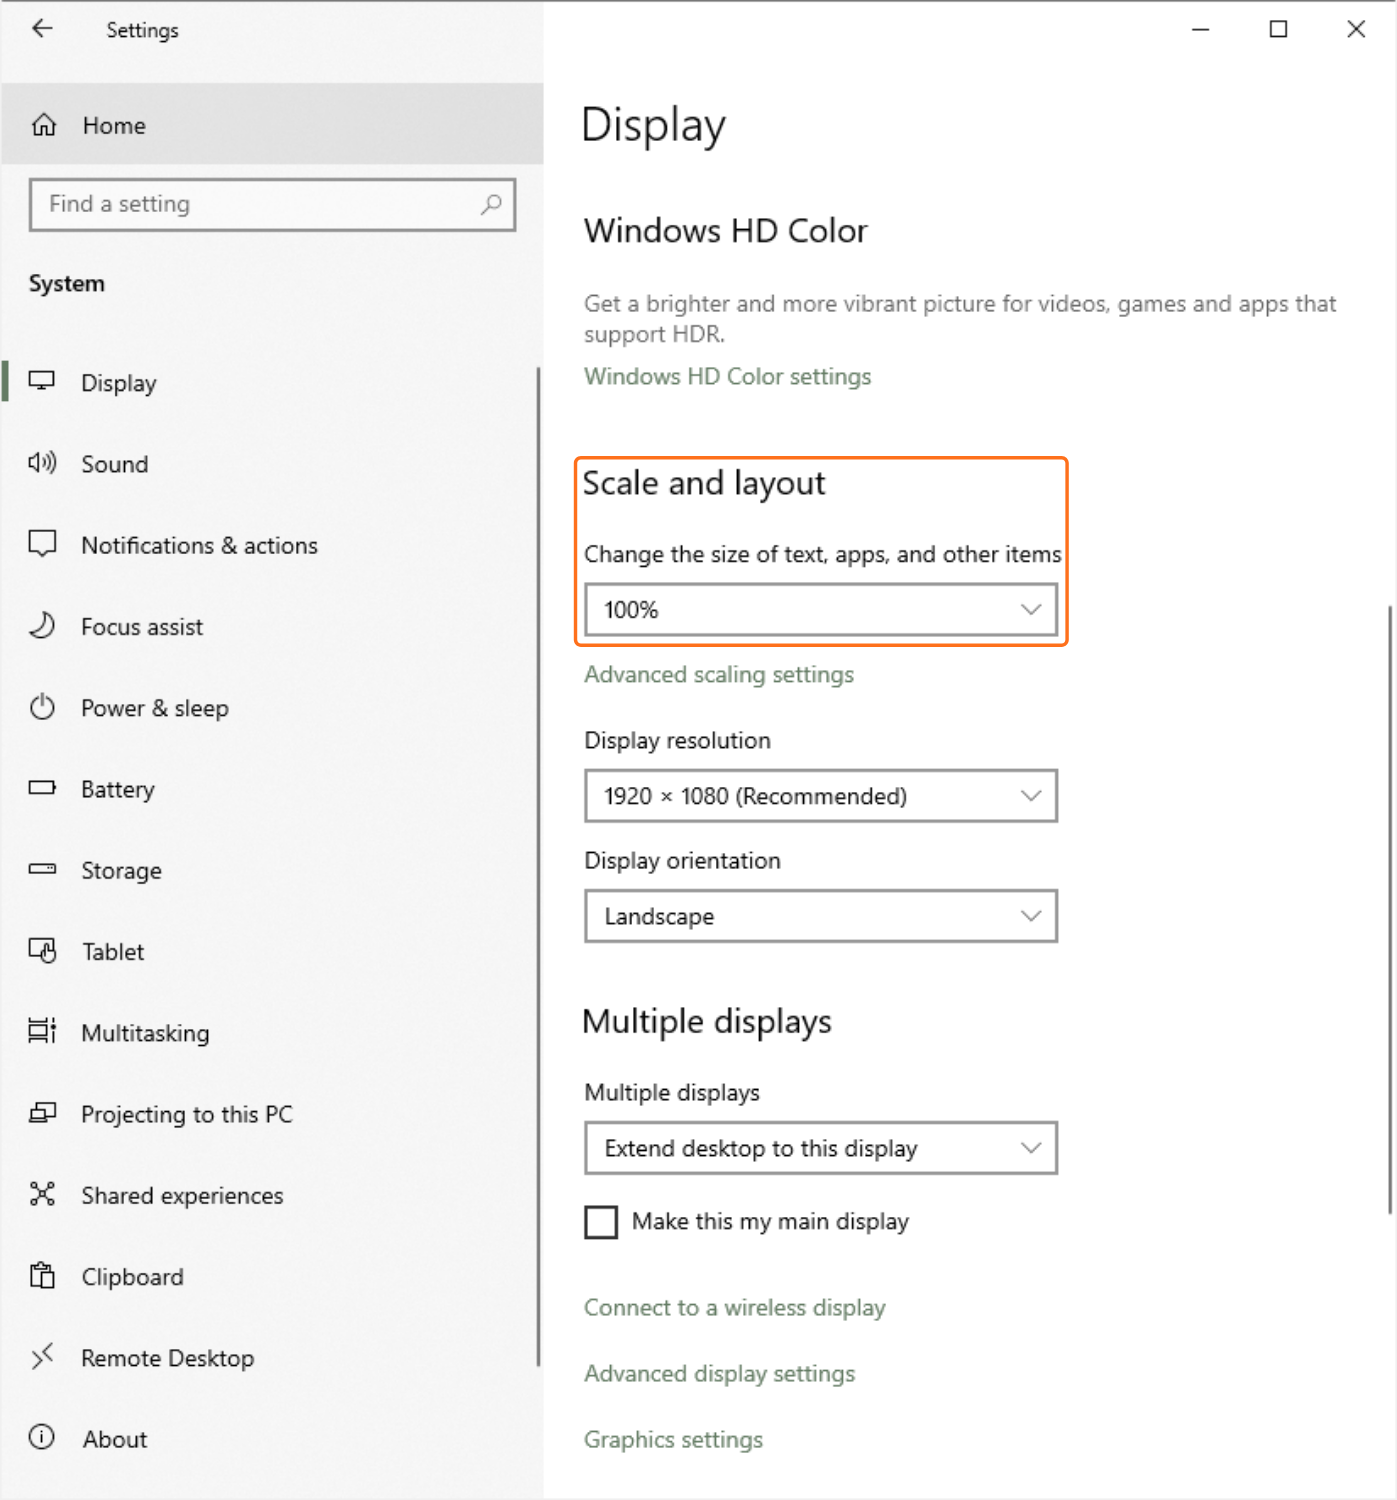
Windows display settings are the most common issue causing the tooth chart to be covered by the Quick Charting. If you are experiencing this issue we advise the following.
Right click on your Windows Desktop and select Display Settings
Scroll down to the section titled Scale and Layout
Change the screen resolution (to meet EXACTs minimum requirement)
and/orReduce Windows text or scaling size to the default setting (highlighted in the image below)
To apply changes, log out of Windows and back in.